Demonstrates a function extension, which profiles the performance of add-in functions
Overview
This sample add-in demonstrates a simple function extension.
The classes in ProfilingTool.h provide a simple
mechanism for measuring the performance of add-in functions.
A function that wants to have its performance measured should
create a Timer object, e.g.:
 CopyC++
Profiling::Timer timer(theProfiler, "SlowFunc2");
When the object goes out of scope it will be destroyed, and the destructor will stop the timer and add the result to the Profiler object.
There are also two functions which report the results of the profiling. GetProfilingResults() returns the accumulated results as an array. ProfilerReport() is a macro which prints the results to the TRACE window, and also copies the results to the clipboard (from which they can be pasted into Excel or into a text file).
Requirements
To edit the functions in this add-in, you need to load the extension file
Profiling.xpe which is located in the sample directory.
See Loading an extension file
for instructions.
The function extension
This is a good opportunity to use a function extension:
- The code to be added is slightly different for each function - the function's name, as passed to the Timer, is different. Therefore cut/paste is tedious and error-prone. Using a function extension means that the code will be generated, and will not contain errors.
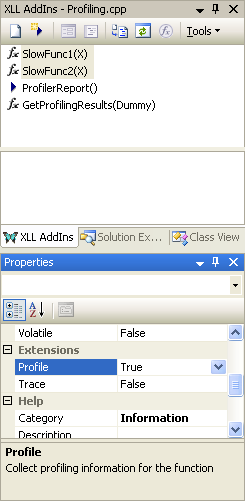
- When you've finished profiling, you may wish to remove the profiling code from some or all functions. Later, you may wish to switch it back on. The XLL Add-ins Window makes this very easy. Select all the relevant functions in the XLL Add-ins Window and change the value of the Profile property in the Properties Browser.
The extension is in Profiling.xpe.
It contains 4 essential items:
-
A reference to
ProfilingTools.h, which ensures that the code will be included in any file that uses the extension. - A LocalizedDisplayName element which controls how the extension will appear in the Property Browser.
- A LocalizedDescription element which provoides help in the Property Browser.
- An Insertion element, which species the code which will be inserted by the extension, and its location.
Classes and functions used
CXlOper::GetDims | CXlOper::IsMissing | CXlOper::VectorCell | CXlOper::AllocArray | CXlOper::Cell | CXlOper::RetError | CXlOper::Ret
Sample project
Each sample project is located in a sub-directory of the Samples directory of the XLL+ installation. To use the sample project, open the solution file Profiling.sln or the project file Profiling.vcproj.
You can enable debugging under Excel by using the Setup Debugging command in the XLL+ ToolWindow.
When delivered, the help files are excluded from the build.
You can enable the help build by selecting the files
Profiling.help.xml and
Profiling.chm
in the Solution Explorer,
and using the right-click menu to view Properties.
Select the page "Configuration Properties/General" and
set the "Excluded from build" property to "No".
See Generating help
in the User Guide for more information.
See Also
List of Sample Projects | Function extensions (User Guide) | FunctionExtension element (Reference)